9 How to Evaluate the Fine-Tuning Process
What is LOSS? LOSS is a differentiable mathematical function that quantifies the error between a model’s predictions and the ground truth. A larger value indicates a larger error. Note that loss is not necessarily related to the actual effectiveness of model fine-tuning; it is only used to observe whether the fine-tuning process is proceeding normally. During fine-tuning, it serves as the optimization objective, guides parameter updates, evaluates training performance, and helps determine when to stop training.
Read in Chinese→9 How to Evaluate the Fine-Tuning Process
What Is LOSS?
LOSS is a differentiable mathematical function that quantifies the error between a model’s predictions and the ground truth.
A larger value indicates a larger error.
Note: Loss is not necessarily related to the actual effectiveness of model fine-tuning; it is only used to observe whether the fine-tuning process is proceeding normally.
What Is It Used for During Fine-Tuning?
The core objective of fine-tuning is to make LOSS progressively smaller.
It serves as the optimization objective, guides the direction of parameter updates, evaluates training performance, and determines when to stop training.
How Does It Get Smaller?
Model parameters are adjusted through gradient descent. This essentially involves tuning the hyperparameters mentioned in the previous article.
Adjustments for Several Scenarios
1. Loss does not decrease: Loss remains high throughout training, with no downward trend
• Learning Rate is too low: Parameter updates are too small, making it difficult to optimize the model. • The data lacks patterns: The data contains many outliers, or the dataset quality is too poor.
- Loss continues to decrease but does not converge: Loss keeps decreasing, but convergence is extremely slow, and it still has not reached the desired level by the end of training.
• The number of training epochs is too low. • Learning Rate is too high: Parameter updates are too large.
- Loss fluctuates: The Loss curve continues to move up and down.
• Batch Size is too small: Individual updates fluctuate significantly, with no stable downward trend.
Further Evaluation Using the Validation Loss Curve
Several scenarios:
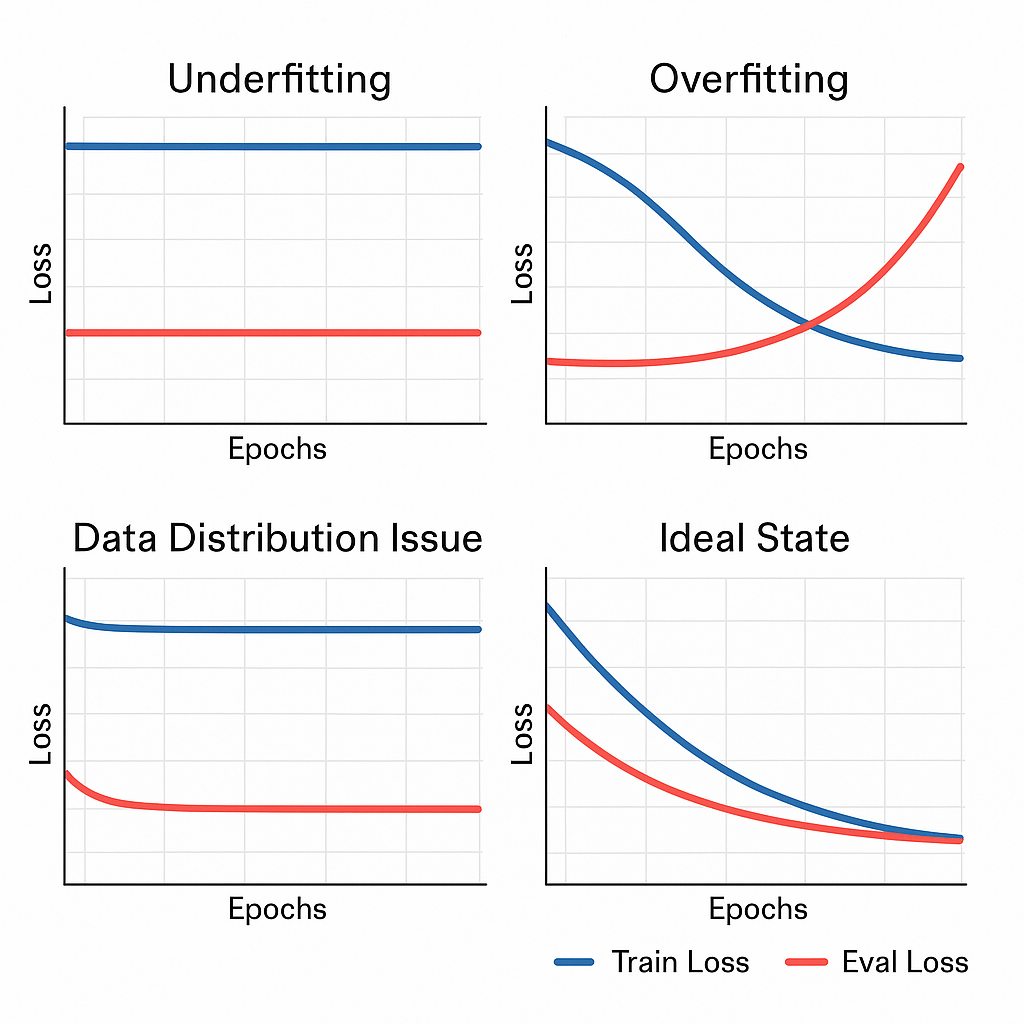
This image shows four typical patterns of training-loss and validation-loss curves:
- Underfitting (top left): Both training loss and validation loss remain high and plateau in parallel.
- Increase the learning rate or LoRA rank, or improve the quality of the dataset.
- Overfitting (top right): Training loss continues to decrease, while validation loss first decreases and then increases, forming the classic overfitting pattern.
- Lower the learning rate, increase regularization, use early stopping, or increase the amount of data.
- Data distribution issue (bottom left): Training loss is high while validation loss is low, creating a clear gap.
- The validation set may be simpler than the training set or contain more noise or difficult examples.
- The validation set may be too small to be representative.
- Ideal state (bottom right): Training loss and validation loss decrease together, indicating healthy convergence.